A metric to track how happy and engaged are your employees
26/04/16 12:18 Filed in: Employee engagement
If you are a team manager or work in the human resources department then you’ve asked yourself this question: How can I know how happy are my team members/employees? We did, many times, and because no other tool out there helped me to know that. We’ve decided to create Happy Mood Score.
Employee happiness is a broad term, it includes employee engagement, motivation, loyalty, commitment, etc. There are many ways companies are doing this right now: Performance reviews, yearly assessments, employee surveys, 1 on 1 interviews, using NPS (Net promoter score) with employees…
All of these methods are not good enough. Some of them are not frequent enough and some others like NPS are intended to measure how customers perceive our company/product not to measure how our employees feel and to give us feedback.
We needed a better process to track employee happiness but this new process should meet these 4 requirements:
With all those requirements in mind Happy Mood Score was created.
It all starts with a simple question that we ask to each employee at the end of a fixed time period. That period can be a day, a week or a month. We recommend weekly as the best interval but for some specific companies daily or monthly makes perfect sense.
We send an email to the employee asking: How was your (day/week/month)?. The employee can choose between one of these three options: Worse than expected, as expected or better than expected.
After voting, employees can leave feedback explaining their vote. What they did, accomplishments, things to improve, explain problems they have face, etc. They can speak freely because feedback is confidential and only the team manager can see it.
Based on that information we calculate the HMS for each employee.
Values closer to -10 indicate that employees are not happy.
The job they are doing is not fulfilling their expectations. Employees with low HM are frustrated, unmotivated and thinking about to leave our company. Our job as managers is to detect these unhappy employees as fast as possible and based on their feedback take the necessary steps to increase their satisfaction and therefore increase their HMS value.
Values between -3 and +3 indicate that the work employees are doing is aligned with what they had in mind.
Employees with values closer to zero are fine. Their work is going as they expected when they started the job. Our job as managers is to be sure they maintain or increase these values. 80% of our employees should stay between this range.
Values from +3 to +10 indicate that employees are better than they had expected.
These people are really happy, motivated and engaged. They think things are going better than expected. We need to pay attention to their feedback to know the reasons they feel this way and try to use that knowledge to increase other employee’s happiness.
We have a metric that is easy to understand, provide us with good feedback and is not intrusive or complex for our employees. We just need an easy way for us as team managers or Human Resources people to track the evolution.
Inside Happy Mood Score you will have access to three important sections. Note: All the information available can be filtered by employee, team or globally. You will always have the level of detail that you need.
The dashboard. It has both the global HMS and involvement value and the most recent votes and feedback. It is designed to answer one question: How are things going with my employees today?
Global stats. Here you have a graphical evolution of the HMS value for the last 6 weeks and the last 6 months. The 6 weeks graphic is perfect to let you know how effective are short term changes while the 6 months graphic will help you know how mid-term changes are working. This section will answer you this question: How things are evolving?
Team rank. You will find a list of employees ranked by highest and lowest HMS values. This section helps you focus on the people that really needs you most. This section will answer this question: Which employees need my attention the most?.
We really believe in HMS. I think it is a good metric that will help companies to get feedback and improve talent retention.
There are no excuses. Create your account, add your employees and select how frequent you want to track them (daily/weekly/monthly). You can import your employees from a CSV file or from Pivotal Tracker.
Happy Mood Score has also a peer-to-peer reward system. Your employees can give High 5 to other co-workers and show their appreciation.
We have a powerful gamification system included. Every action is gamified and will allow employees to gain points, earn badges, increase their level and be engaged and motivated.
If you have any doubts leave a comment or contact us here: info [at] happymoodscore.com.
Thanks for reading about the Happy Mood Score measuring system. You can create an account.
HMS (Happy Mood Score) is not only the name of a tool. It’s a metric that we have developed that will help you to know how happy and engaged your employees are.
What is employee happiness?
Employee happiness is a broad term, it includes employee engagement, motivation, loyalty, commitment, etc. There are many ways companies are doing this right now: Performance reviews, yearly assessments, employee surveys, 1 on 1 interviews, using NPS (Net promoter score) with employees…
All of these methods are not good enough. Some of them are not frequent enough and some others like NPS are intended to measure how customers perceive our company/product not to measure how our employees feel and to give us feedback.
We needed a better process to track employee happiness but this new process should meet these 4 requirements:
- It needs to be done on a regular basis (ideally on a weekly basis).
- It needs to be fast and easy. It should not stand in the way of the employee (the process should take less than 5 minutes).
- It needs to provide us with feedback.
- It needs to be easy for managers to follow the evolution of both the team and each individual employee.
With all those requirements in mind Happy Mood Score was created.
How we calculate the Happy Mood Score
It all starts with a simple question that we ask to each employee at the end of a fixed time period. That period can be a day, a week or a month. We recommend weekly as the best interval but for some specific companies daily or monthly makes perfect sense.
We send an email to the employee asking: How was your (day/week/month)?. The employee can choose between one of these three options: Worse than expected, as expected or better than expected.
After voting, employees can leave feedback explaining their vote. What they did, accomplishments, things to improve, explain problems they have face, etc. They can speak freely because feedback is confidential and only the team manager can see it.
Based on that information we calculate the HMS for each employee.
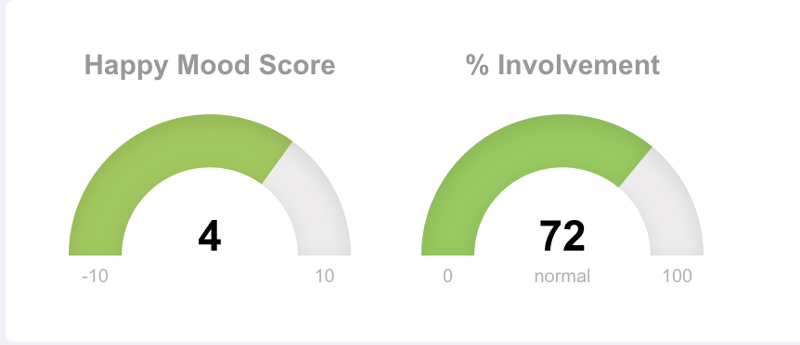
HMS is a metric that ranges from -10 up to +10.
Values closer to -10 indicate that employees are not happy.
The job they are doing is not fulfilling their expectations. Employees with low HM are frustrated, unmotivated and thinking about to leave our company. Our job as managers is to detect these unhappy employees as fast as possible and based on their feedback take the necessary steps to increase their satisfaction and therefore increase their HMS value.
Values between -3 and +3 indicate that the work employees are doing is aligned with what they had in mind.
Employees with values closer to zero are fine. Their work is going as they expected when they started the job. Our job as managers is to be sure they maintain or increase these values. 80% of our employees should stay between this range.
Values from +3 to +10 indicate that employees are better than they had expected.
These people are really happy, motivated and engaged. They think things are going better than expected. We need to pay attention to their feedback to know the reasons they feel this way and try to use that knowledge to increase other employee’s happiness.
A dashboard to display our employees happiness
We have a metric that is easy to understand, provide us with good feedback and is not intrusive or complex for our employees. We just need an easy way for us as team managers or Human Resources people to track the evolution.
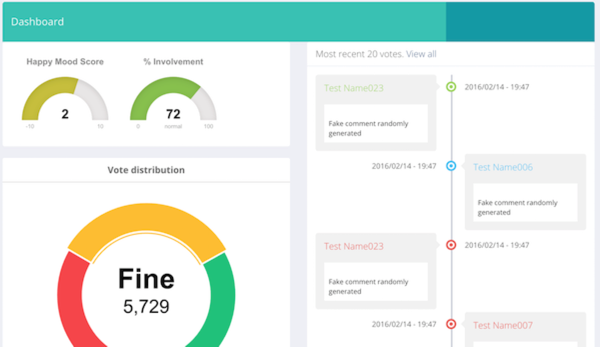
Inside Happy Mood Score you will have access to three important sections. Note: All the information available can be filtered by employee, team or globally. You will always have the level of detail that you need.
The dashboard. It has both the global HMS and involvement value and the most recent votes and feedback. It is designed to answer one question: How are things going with my employees today?
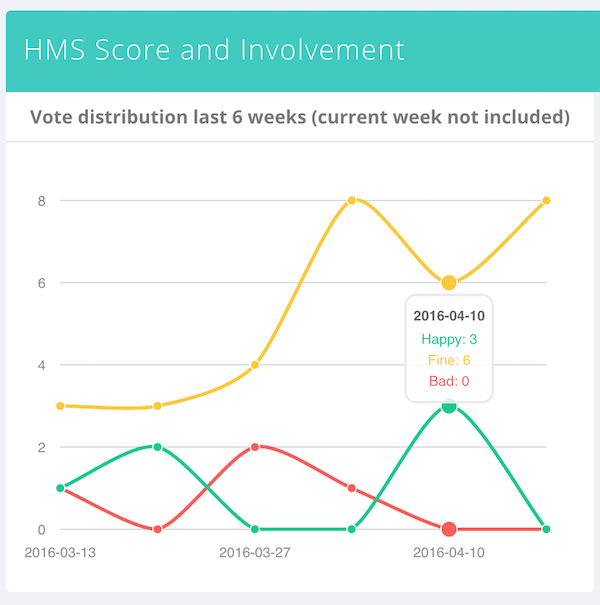
Global stats. Here you have a graphical evolution of the HMS value for the last 6 weeks and the last 6 months. The 6 weeks graphic is perfect to let you know how effective are short term changes while the 6 months graphic will help you know how mid-term changes are working. This section will answer you this question: How things are evolving?
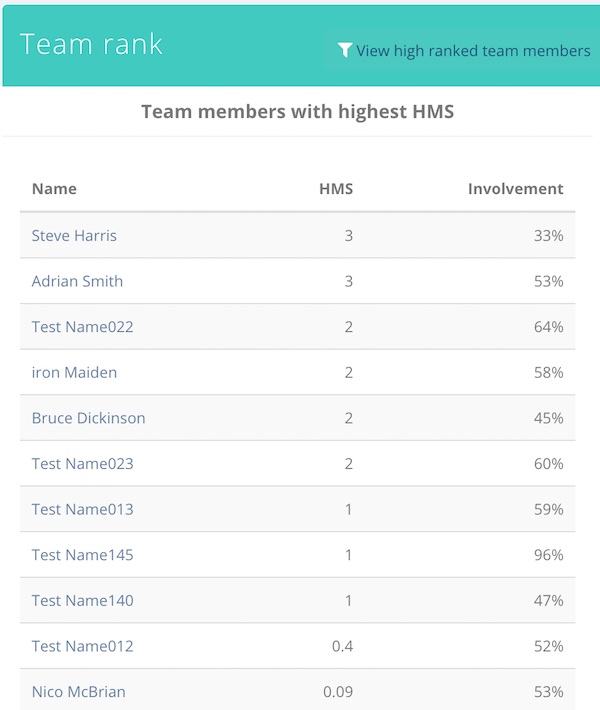
Team rank. You will find a list of employees ranked by highest and lowest HMS values. This section helps you focus on the people that really needs you most. This section will answer this question: Which employees need my attention the most?.
The best employee engagement tool
We really believe in HMS. I think it is a good metric that will help companies to get feedback and improve talent retention.
There are no excuses. Create your account, add your employees and select how frequent you want to track them (daily/weekly/monthly). You can import your employees from a CSV file or from Pivotal Tracker.
Extra ball
Happy Mood Score has also a peer-to-peer reward system. Your employees can give High 5 to other co-workers and show their appreciation.
We have a powerful gamification system included. Every action is gamified and will allow employees to gain points, earn badges, increase their level and be engaged and motivated.
If you have any doubts leave a comment or contact us here: info [at] happymoodscore.com.
Thanks for reading about the Happy Mood Score measuring system. You can create an account.